


 11 / 20

2016 ANNUAL REPORT
9
Association Statistics Put Foreign Trade Front & Center with
New Dashboard:
As a strategic service provider to the industry,
the Aluminum Association developed a brand-new statistical report
this year to help aluminum watchers better understand metal
flows between the U.S. and other aluminum producing countries.
The Excel-based
Foreign Trade Dashboard
uses Global Trade Atlas
to provide subscribers quick and easy access to all the latest
aluminum import data. The interactive
Dashboard
allows users
to manipulate the trade data to their specific needs, whether
for internal analyses, identifying market opportunities, or tracking
the impact of key events on the flow of aluminum.
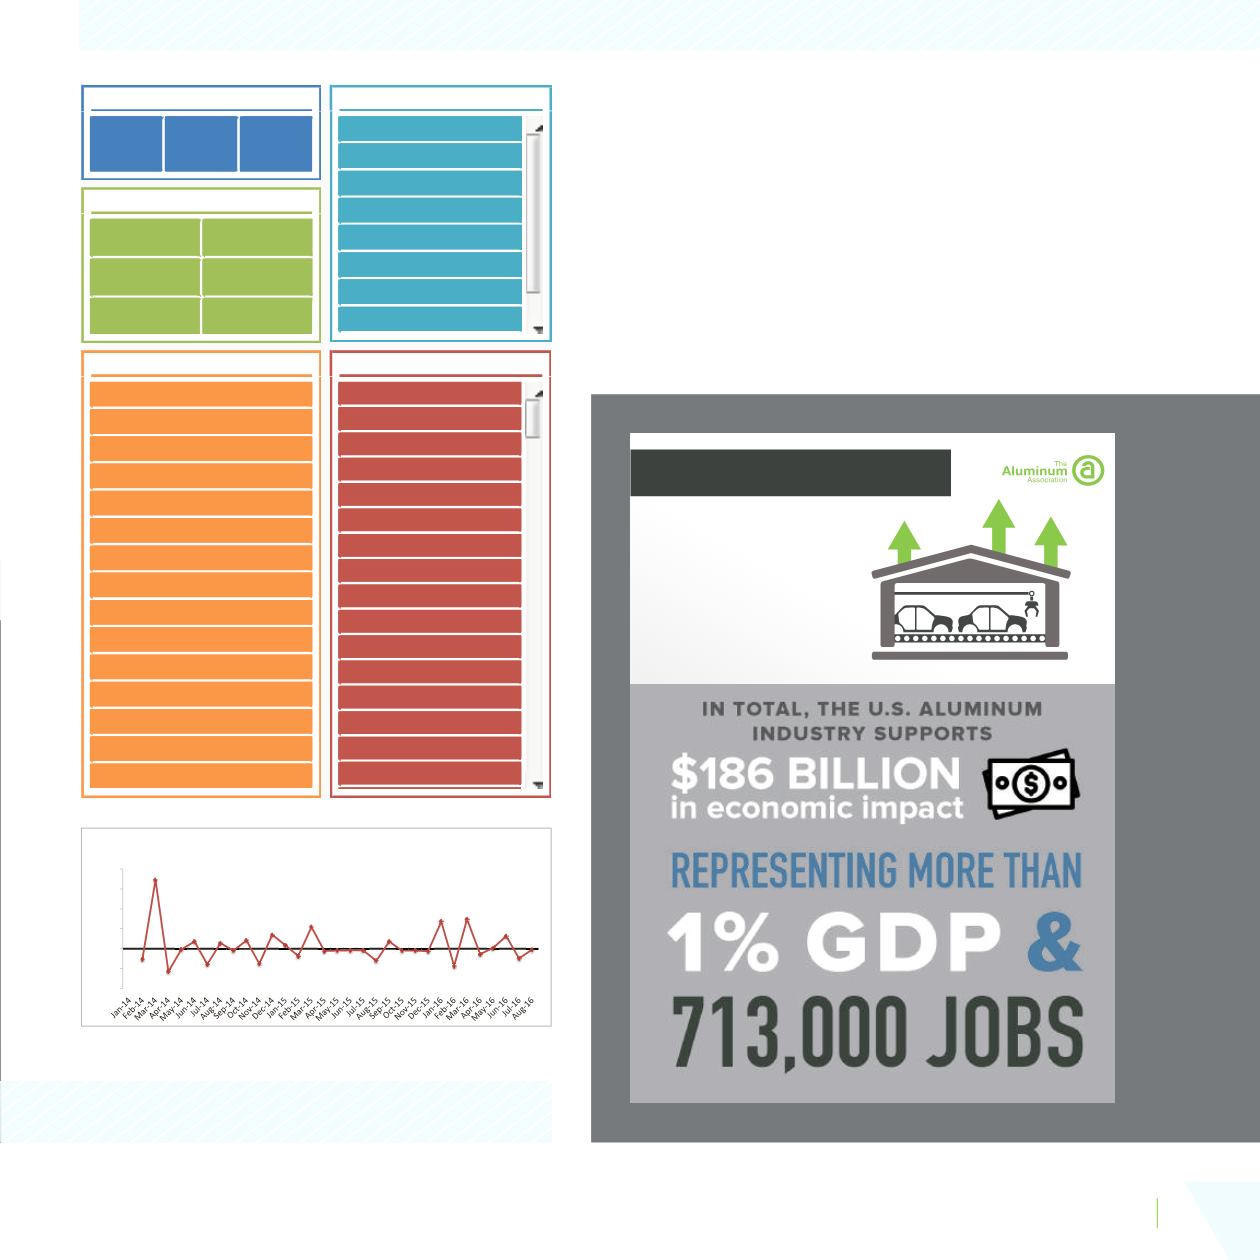
Planning for Growth
$2.6B
IN INVESTMENTS
to meet anticipate demand growth
for aluminum in the automotive sector
7,953.4
8,374.3
9,606.2
0
5,000
10,000
15,000
2014
2015
2016
U.S. Imports (
YTD - Aug.
)
(Millions of Pounds)
3.5% 3.1%
64.6%
5.2%
9.5%
14.2%
U.S. Imports by Product Category (
YTD - Aug.
)
(% Share, Defult = 2016)
Extrusions Foil
Ingot
Other Scrap Sheet & Pl
4,612.5
1,099.1
796.3
759.7
286.9
0
1,000
2,000
3,000
4,000
5,000
Canada
Russia UnitedArab
Emirates
China
Bahrain
Top 5 Importing Countries (
2016 Only
)
(Millions of Pounds)
Select Year:
2014
2015
2016
Product Category
Extrusions
Foil
Ingot
Other
Scrap
Sheet & Plate
Product Form
ACSR & Bare Cable
CasƟngs
Circles & Discs
Extruded Shapes
Foil
Forgings
Ingot
Pipe & Tube
Plate
Powder & Paste
Redraw Rod
Rod & Bar
Scrap & Dross
Sheet
Wire
Region
Africa
Asia
Australia and Oceania
Central America
Europe
Middle East
North America
South America
Partner Country
Afghanistan
Albania
Andorra
Anguilla
AnƟgua & Barbuda
ArgenƟna
Armenia
Aruba
Australia
Austria
Bahamas
Bahrain
Bangladesh
Barbados
Belarus
Belgium
873.1
780.8
1,321.0
1,018.3
1,009.1
1,080.2
910.4
960.5
942.1
1,018.5
864.1
983.6
1,016.1
940.1
1,144.6
1,117.8
1,095.8
1,075.8
1,056.5
927.8
994.4
973.2
954.2
930.2
1,182.8
976.1
1,265.5
1,195.6
1,202.6
1,354.5
1,220.4
0
200
400
600
800
1,000
1,200
1,400
1,600
Monthly U.S. Imports, 2014 - 2016
(Millions of Pounds)
The Aluminum Association introduced a foreign trade statistical dashboard in 2016.
36.8
33.4
598.4
46.6
107.1
138.2
39.4
35.6
557.1
48.6
98.7
148.4
41.1
41.3
763.5
66.9
121.8
174.2
0.0
500.0
1,000.0
Extrusions
Foil
Ingot
Other
Scrap
Sheet & Plate
U.S. Imports, Year -Over-Year
(Millions of Pounds)
August - 2016 August - 2015 August - 2014
ug.
)
eet & Plate
January
February
March
April
May
June
July
August
September
October
November
December
-10.6%
69.2%
-22.9%
-0.9%
7.0%
-15.7%
5.5%
-1.9%
8.1%
-15.2%
13.8%
3.3%
-7.5%
21.8%
-2.3%
-2.0%
-1.8%
-1.8%
-12.2%
7.2%
-2.1%
-1.9%
-2.5%
27.2%
-17.5%
29.6%
-5.5%
0.6%
12.6%
-9.9%
-1.0%
-40.0%
-20.0%
0.0%
20.0%
40.0%
60.0%
80.0%
Monthly U.S. Imports, 2014 - 2016
(M-o-MPercentChange)
1,354.5
1,220.4
1,208.8